
 E-Paper



Online dashboard offering fuller picture of farm fires unveiled
Fire Watch, accessible through https://firewatch.iforest.global/, tracks three key measures — the number and location of active fires, the time of day when burning is most intense, and the area affected over the burning season, according to a press release

 Prefer HTon Google


The International Forum for Environment, Sustainability and Technology (iFOREST) has launched Fire Watch, a multi-satellite online dashboard, offering a more complete picture of crop residue burning.
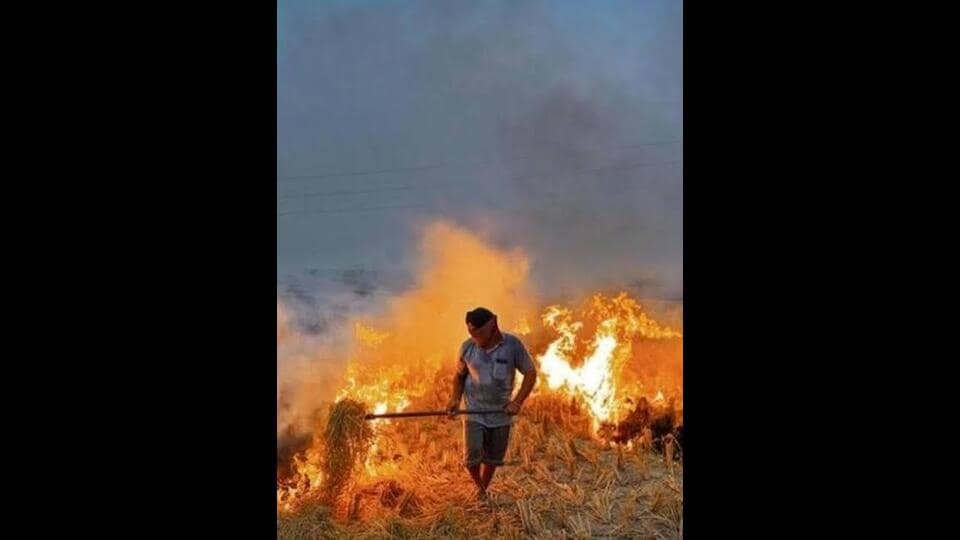
Fire Watch, accessible through https://firewatch.iforest.global/, tracks three key measures — the number and location of active fires, the time of day when burning is most intense, and the area affected over the burning season, according to a press release.
It currently covers Punjab, Haryana, Uttar Pradesh and Madhya Pradesh, with more states planned for the next phase.
Dr Chandra Bhushan, CEO of iFOREST, said current monitoring relied on fire counts from polar-orbiting satellites, which gave an incomplete picture of stubble burning. “To design effective interventions, we need to know not only how many fires are detected, but also where and when burning takes place and how much land is affected. Fire Watch brings these data together to make better information available to policymakers and the public,” he said.
According to the release, polar-orbiting satellites, including MODIS and VIIRS, identify active fires and show their distribution down to the district level, but because they pass over a location only at certain times, they miss many fires.
“Geostationary satellites Meteosat 8 and Meteosat 9 carrying the SEVIRI sensor provide observations approximately every 15 minutes, helping identify the hours when burning peaks. High-resolution Sentinel-2 imagery is then used to compare land conditions before and after the burning season, and estimate the total agricultural area burnt. Together, these sources give a fuller picture than fire counts alone,” it added.


