E-Paper



Number Theory: Statistical deviations made February weather better, not worse
February 2024 was among the top 20 warmest or coolest since 1951 in all states where the temperature deviated by 1°C on either side of the normal.
Published on: Mar 4, 2024, 08:43:33 IST

Share via


Copy link

February 2024 did see large enough statistical deviations from what is considered normal weather. But these deviations made the weather feel pleasant rather than harsh in most parts of the country, at least with respect to temperature. Here is why.

Statistical deviations made February weather better, not worse
- India's average may not show how February weather was in different regionsAll-India average temperatures moved closer to normal in February compared to January. India’s average maximum was 26.58°C in February, according to India Meteorological Department’s (IMD) gridded dataset. This is the 0.77°C below the 1981-2010 average – considered the normal for temperature -- for the first 29 days after January compared to 1.08°C deviation below normal in January. Similarly, India’s minimum averaged 13.51°C in February, 0.24°C above normal, compared to 0.38°C above normal in January. Although a single day’s temperature trends are unlikely to make a big dent in the monthly average, February 2024 has been compared with the first 29 days after January throughout this analysis because 2024 is a leap year.
 But temperatures deviated by more than 1°C in a majority of statesWhile a 1°C deviation in temperature is not a threshold that suggests extreme weather at the local level, this degree of deviation in state averages of temperature are indeed extreme. For example, February 2024 was among the top 20 warmest or coolest since 1951 in all states where the temperature deviated by 1°C on either side of the normal. Of the 30 states and UTs for which this calculation is possible using IMD’s gridded data, the maximum was 1°C above or below normal in 16 and the minimum breached this threshold in 17. To be sure, the maximum was generally below normal in most parts of the country. Maximums were 1°C or more above normal in only seven states: Andhra Pradesh, Telangana, Kerala, Gujarat, Manipur and Mizoram. Minimums, on the other hand, were generally above normal. Only six states recorded minimums that were at least 1°C below normal in the month. These are: Jammu and Kashmir, Ladakh, Himachal Pradesh, Uttarakhand, Nagaland, and Sikkim. Simply speaking this means that days were not very hot and the nights not very cold in a month with generally pleasant temperatures in most of India. For example, the hottest state in the month – Telangana – averaged a maximum of 34.2°C. Only Jammu and Kashmir experienced an average maximum below 10°C. Minimums, similarly, averaged below zero in only Jammu and Kashmir and Ladakh, where the minimum deviated by more than 4°C. Only five other states averaged minimums below 10°C. These were Haryana, Punjab Uttarakhand, Himachal Pradesh, and Sikkim.
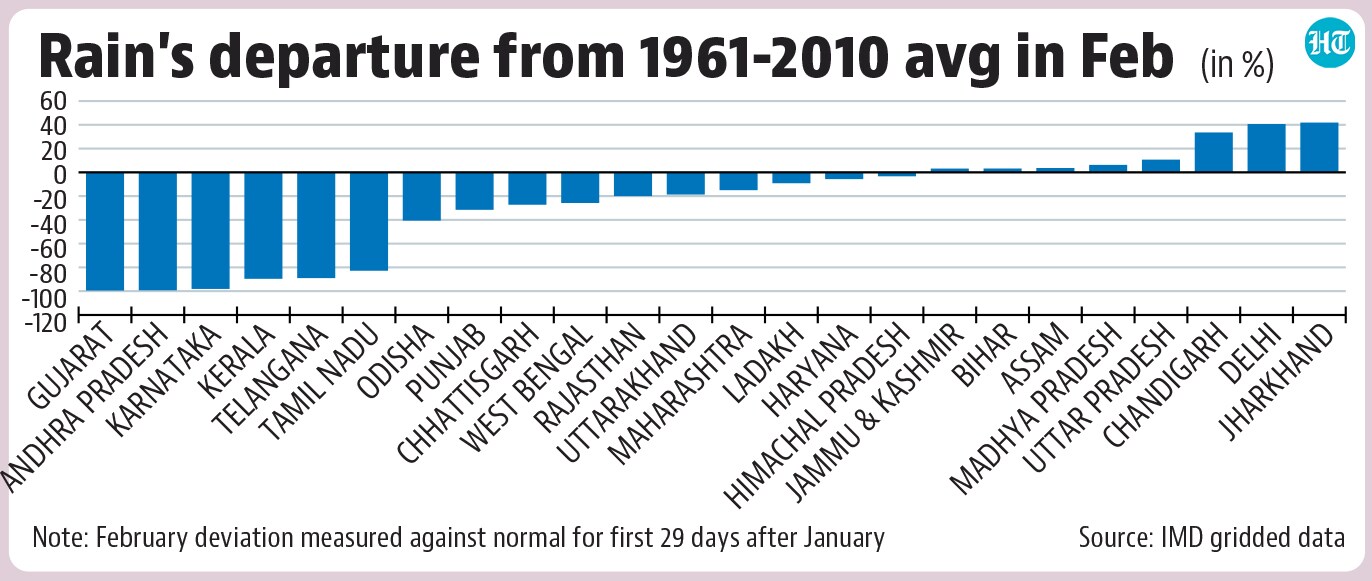
- India's rain average also does not suggest extreme patterns, but state averages doIndia received 20.2 mm rain at the country level in February 2024. This is only 7.6% less than the average rain for the first 29 days after January during 1961-2010, a benchmark for rain; and only 62nd highest or 63rd lowest rain for the period since 1901, the earliest year for which IMD has gridded data for rain. This suggests that rain’s departure in February was not very extreme. However, this was not the case at the regional level. Of the 31 states for which this calculation is possible for rain using IMD’s gridded data, 12 had a deficit of over 20%, which IMD classifies as “deficient”. Six states, on the other hand, had a deficit of over 80%, which makes them “large deficient” in IMD classification. Similarly, eight state and UTs – Chandigarh, Delhi, Jharkhand, and all north-eastern states except Manipur, Mizoram, and Assam -- had a surplus of over 20%, which is classified as 'excess'.
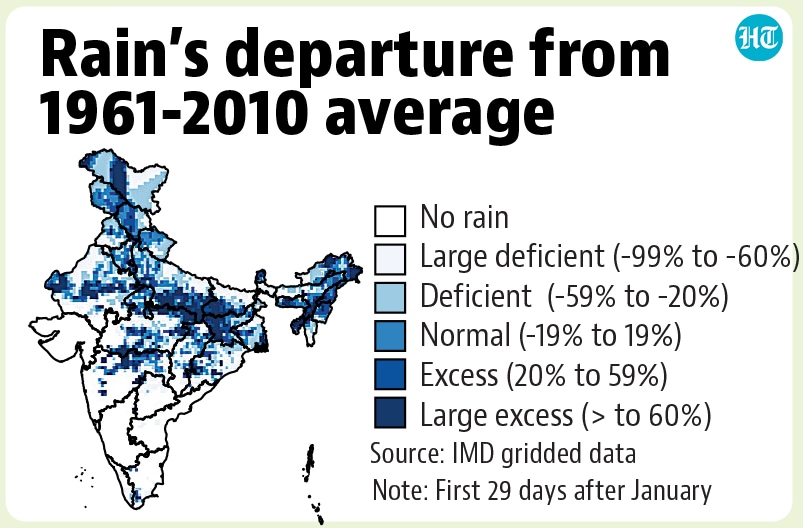
- There were wide variations in rainfall even within statesFor example, a string of western disturbances helped keep rain deficit in Himachal Pradesh to just 3.3% after a very dry January in the state. However, different regions of the state experienced the month very differently. A third of the state’s area was deficient while 40% of the state received excess rainfall. Only 27% of the state received rain within a 20% range of the 1961-2010 average. This trend can also be seen in the accompanying map for states like Uttar Pradesh and Bihar, which have a surplus overall but had big deficits in their northern regions.