
 E-Paper



Second wave spreading much faster in rural India than first
In the first four days of May, rural areas have contributed 1.39 times the number of new cases as urban areas.

 Prefer HTon Google


The second wave of Covid-19 in India has gained traction in the country’s vast rural hinterland, where health care infrastructure is weaker than in urban areas, at a much faster rate than it did during the first wave of the outbreak, shows data analysed by HT.
During the first wave, urban areas contributed a majority of new infections in India every month for five months from March 2020 – the first month when India detected a locally transmitted case of the infection – to July 2020, before rural areas started contributing more new cases than urban areas. In the case of the second wave, which started in February, this has taken just two months.
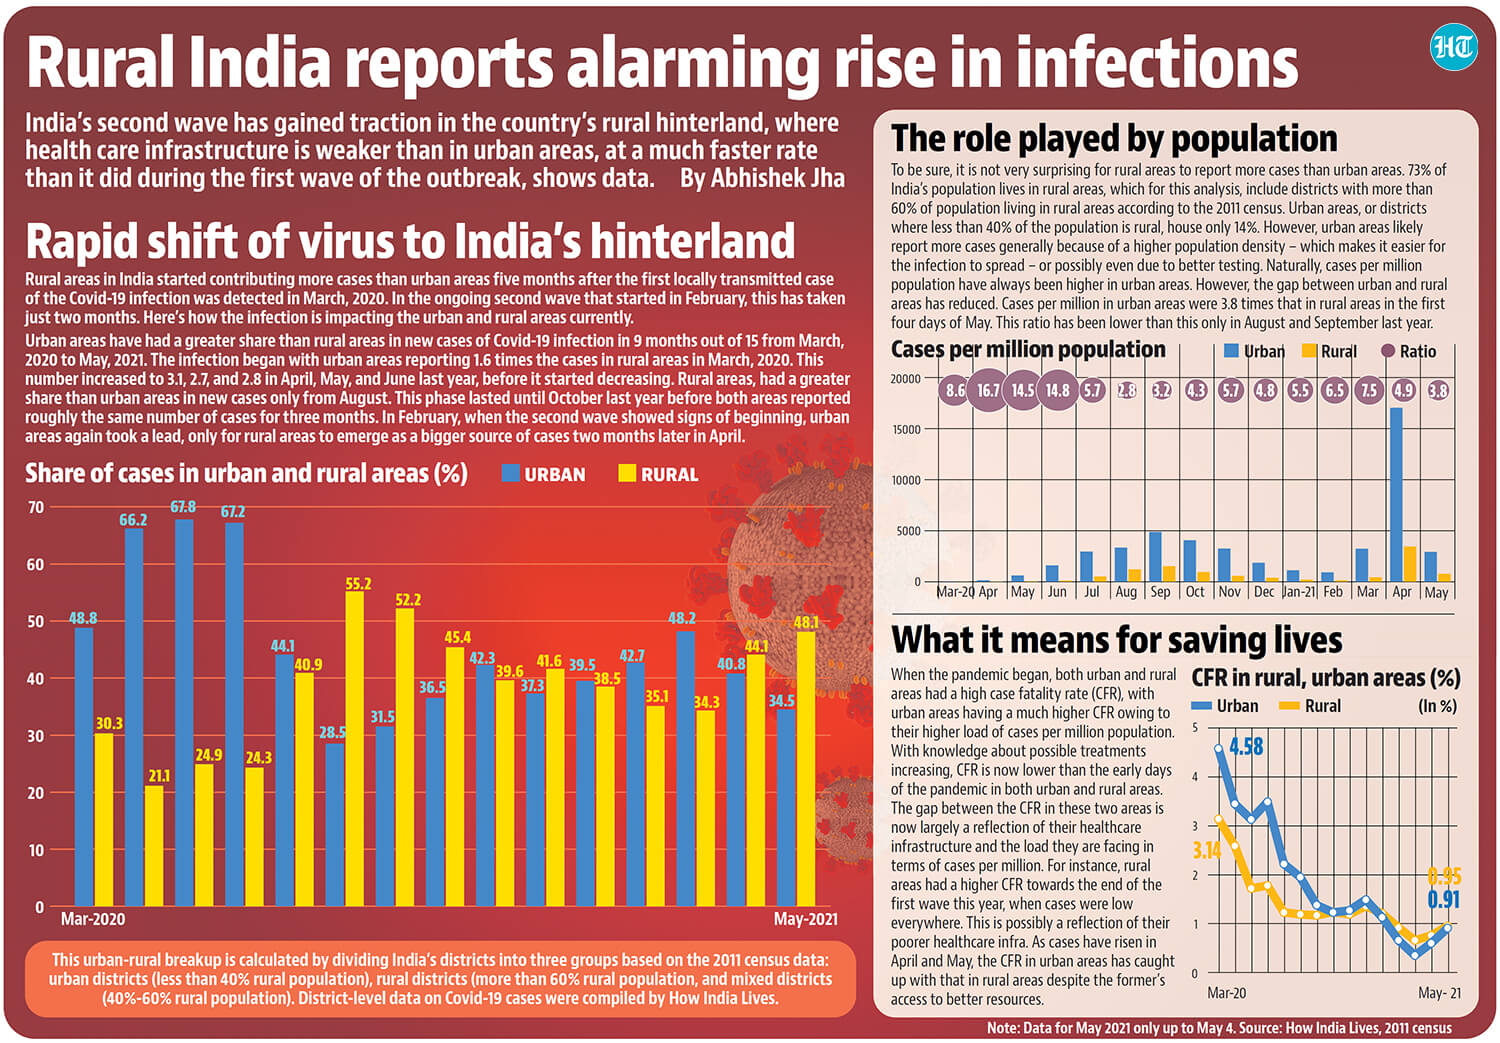
In March, rural areas, where 73% of the country’s population resides, contributed a little over a third (34.3%) of new infections compared to 48.2% contributed by urban areas, where 14% of India’s population lives (the rest came from areas with mixed urban and rural population).
Also read | Third wave of Covid inevitable, says government
In April, rural areas contributed close to half (44.1%) of all new cases, compared to 40.8% contributed by urban areas.
In the first four days of May, rural areas have contributed 1.39 times the number of new cases as urban areas. The only months in which rural areas contributed more cases than urban areas before this was last year, between August and October, and then again in December.
To be sure, in terms of new cases reported per month per million population, urban areas have always stayed ahead of rural areas, and are still ahead currently. In April, urban areas reported 4.9 times the cases per million population compared to rural areas. This number for May was 3.8 until May 4. This could, however, be on account of lack of access to testing in rural areas.
For the purpose of this analysis, India’s 700-plus districts have been classified into three categories on the basis of rural population share: urban districts (less than 40% rural population), rural districts (more than 60% rural population, and mixed districts (40%-60% rural population). District-level data on Covid-19 cases were compiled by How India Lives.



