
 E-Paper



Number theory: The state of India’s consumption at the end of FY 2022-23
India’s GDP suffered a contraction of 5.8% in 2020-21, largely a result of the economic disruption of the 68-day long lockdown which began on March 24, 2020.

 Prefer HTon Google


Fiscal year 2022-23 will come to an end on March 31. The second advance estimates for 2022-23 GDP were released on February 29. The provisional GDP estimates for 2022-23, along with the March quarter numbers, will only be released in the last week of May. However, the end of the fiscal year is a good time to take stock of the economy, and given the pandemic’s disruption, the extent of post-pandemic recovery. HT’s data and political economy team will try and do this in a three-part series. The first part will look at private consumption (it accounts for more than half of India’s GDP), the second, investment and the third, wider market conditions facing the Indian economy.
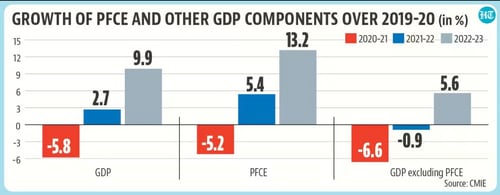
Annual GDP numbers suggest that consumption is driving economic recovery …
Numbers show this clearly. India’s GDP suffered a contraction of 5.8% in 2020-21, largely a result of the economic disruption of the 68-day long lockdown which began on March 24, 2020. The hit to private final consumption expenditure (PFCE), however, was smaller than other components of GDP. Even the post-pandemic recovery -- if one were to use the 2019-20 numbers as the benchmark -- shows that the PFCE component of GDP has had a much bigger recovery than others.
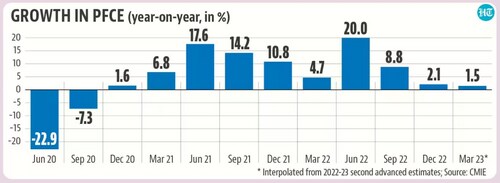
… but numbers for the December quarter suggest that consumption is losing momentum.
Annual growth in PFCE was 20% in the quarter ending June 2022. This number fell to 8.8% in September 2022 and just 2.2% in December 2022, which suggests a weakening of consumption demand momentum in the economy. If one looks at the assumed growth in PFCE in the March 2023 quarter – using second advance estimates for 2022-23 GDP numbers – the slowdown seems to be continuing. To be sure, part of the weakness seen in recent quarterly numbers could be a result of the fact that earlier numbers have undergone an upward revision as part of the National Statistical Office (NSO) revision calendar. While senior officials including the Chief Economic Advisor have argued that this makes a comparison of latest numbers difficult, the fact remains that these are the only numbers available at the moment to make quarterly performance comparisons.
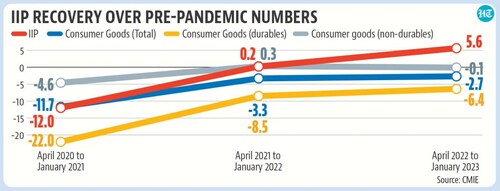
IIP numbers suggest that the manufacturing part of consumption demand is still to recover from pre-pandemic levels.
Index of Industrial Production (IIP) numbers are available till January 2023. The headline IIP number in 2022-23 (April-January) has grown by 5.6% compared to the corresponding pre-pandemic period of 2019-20. However, the consumer goods sub-category of IIP – it has a share of 28.2% in the IIP basket – is still 2.7% lower than its pre-pandemic value. The deficit over pre-pandemic values is significantly bigger in case of consumer durables, which is to be expected, as most of these items represent discretionary consumption unlike essential items most of which are non-durable in nature.
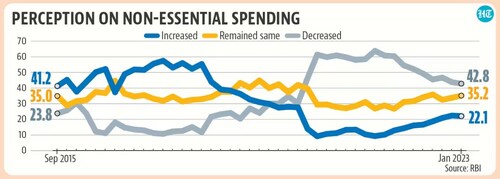
To be sure, RBI data on consumer confidence suggests that things aren’t going downhill
RBI’s consumer confidence survey (CCS) seeks responses on perception about essential and non-essential spending. While net current perception – it is the difference between share of respondents who reported an improvement and worsening compared to a year ago – on non-essential spending continues to be negative, the trajectory shows an ongoing improvement. To be sure, CCS is only conducted in cities and therefore does not tell us anything about the state of rural consumption demand.
Data which we do not have
Many economists have described India’s post-pandemic recovery as K-shaped where the rich (firms and individuals) have done well for themselves but the poor are still struggling. While there is anecdotal evidence about consumption demand of the rich doing well and that of the poor remaining weak, there is no official data to answer this question conclusively. This would not have been the case if India had high frequency surveys like the Periodic Labour Force Survey (PLFS) for measured consumption spending as well. There is no reason why we should not have such a survey.


